Ready to try some new visualizations and data analysis for your 10 GHz and Up Contest logs, or add a page on your website showing your grids worked from your home station? Take a look at the web-based tool at 10ghz.microwavedx.com. These work for any 10 GHz and up log, not just for the contests.
The tools on this page are a combination of two open-source projects, configured for web delivery to make it easy for anyone to use them. They are mostly self-explanatory, but they are fully described here:
- The Contest Log Analyzer project. This is the core of what’s on the page and includes the following features:
- Ingests Cabrillo files or Google Sheets format.
- Converts Google Sheets data to Cabrillo format, if needed. Forward-fill functionality for incomplete spreadsheet data to speed data entry.
- Calculates contest scores with distance-based points and band multipliers for the ARRL 10 GHz and Up Contest
- Creates a summary sheet to assist with posting to 3830scores.com
- Supports all microwave bands (10 GHz through 300+ GHz)
- Handles Maidenhead grid square calculations and distance computations.
- Outputs a variety of analysis and graphical files including polar plots of score by site with per-band analysis.
- Ingests Cabrillo files or Google Sheets format.
- The Grid Mapper project, which includes these features:
- Multi-format Support: Supports both Cabrillo (.cbr/.log) and CSV (.csv) file formats
- Multi-band Analysis: Creates separate maps for each frequency band found in the log
- Automatic Continent Detection: Auto-selects continents based on grid squares in the log
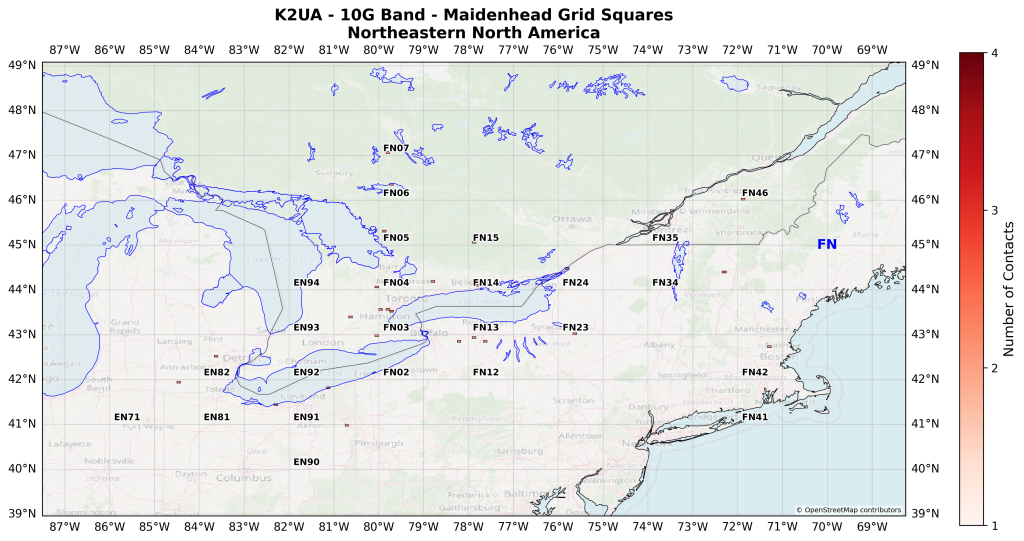
- Manual Continent Selection: Choose specific continents to display Accurate Grid Visualization: Renders actual grid square boundaries (2° × 1° for 4-character, 5′ × 2.5′ for 6-character grids)
- Field Labels: Displays 2-letter grid field designators (EM, EN, EL, etc.) on the map Contact Density: Color-coded intensity showing number of contacts per grid square
- Global Coverage: Supports all continents with optimized map bounds
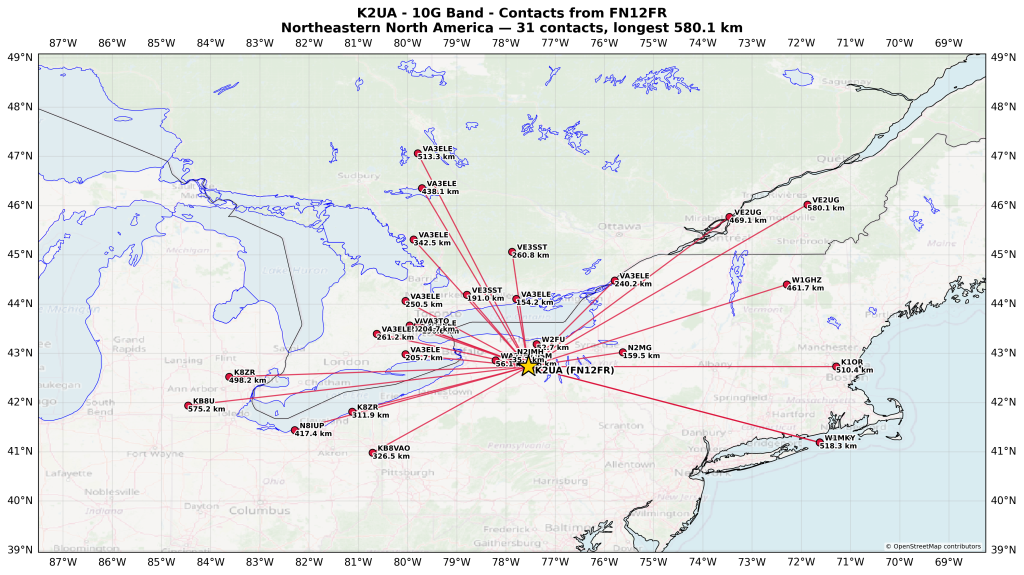
- Local Path Maps: Draws a small-area map connecting your home grid to every worked station with a line, labeled with call sign and distance in kilometers (matching ARRL 10 GHz and Up Contest scoring) — great for showing local operators and newcomers what’s achievable on VHF/UHF/microwave
- Multi-Location Detection: Rover, portable, and multi-op logs that report a different home grid on different QSOs (e.g. a rover moving between stops) are automatically split into a separate graphic per band and per operating location, instead of mixing locations together on one map
- OpenStreetMap Basemap: adds a faint (default 30% opacity) OpenStreetMap street-level tile layer underneath every map generated for 902 MHz and higher bands (33 cm and up), on top of which all the usual layers still draw normally
- Interactive HTML Maps: generates a website-ready interactive version of every map produced in the same run — hover (or tap, on mobile) a grid square or worked-station point to see a popup with that contact’s callsign, date, six-character grid, and other QSO details
An example of the HTML output is available k2ua-10-ghz-grids-worked-from-fn12fr. Pan, zoom, and click on any of the red dots for more information about each contact. You can also generate HTML and/or PNG format graphics for each 6-digit subsquare you work from each operating site in your log, shaded by contact density.
Vector-dot example (right-click and open in a new tab for full resolution):
Subsquare example (right-click and open in a new tab for full resolution):
Check it out at:
10ghz.microwavedx.com and take a peek at the usage stats at 10ghz.microwavedx.com/stats.
Page views: 362064